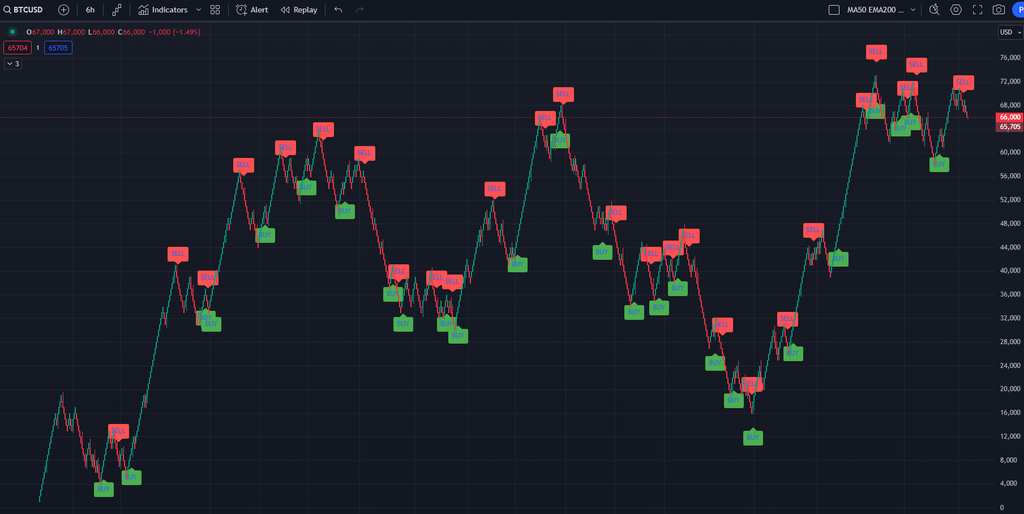
What is a Bull Flag?
A bull flag is a bullish continuation pattern that indicates a brief consolidation before the uptrend resumes. It typically forms after a strong upward price movement, known as the flagpole, followed by a period of sideways to downward consolidation that resembles a flag.
Characteristics of a Bull Flag
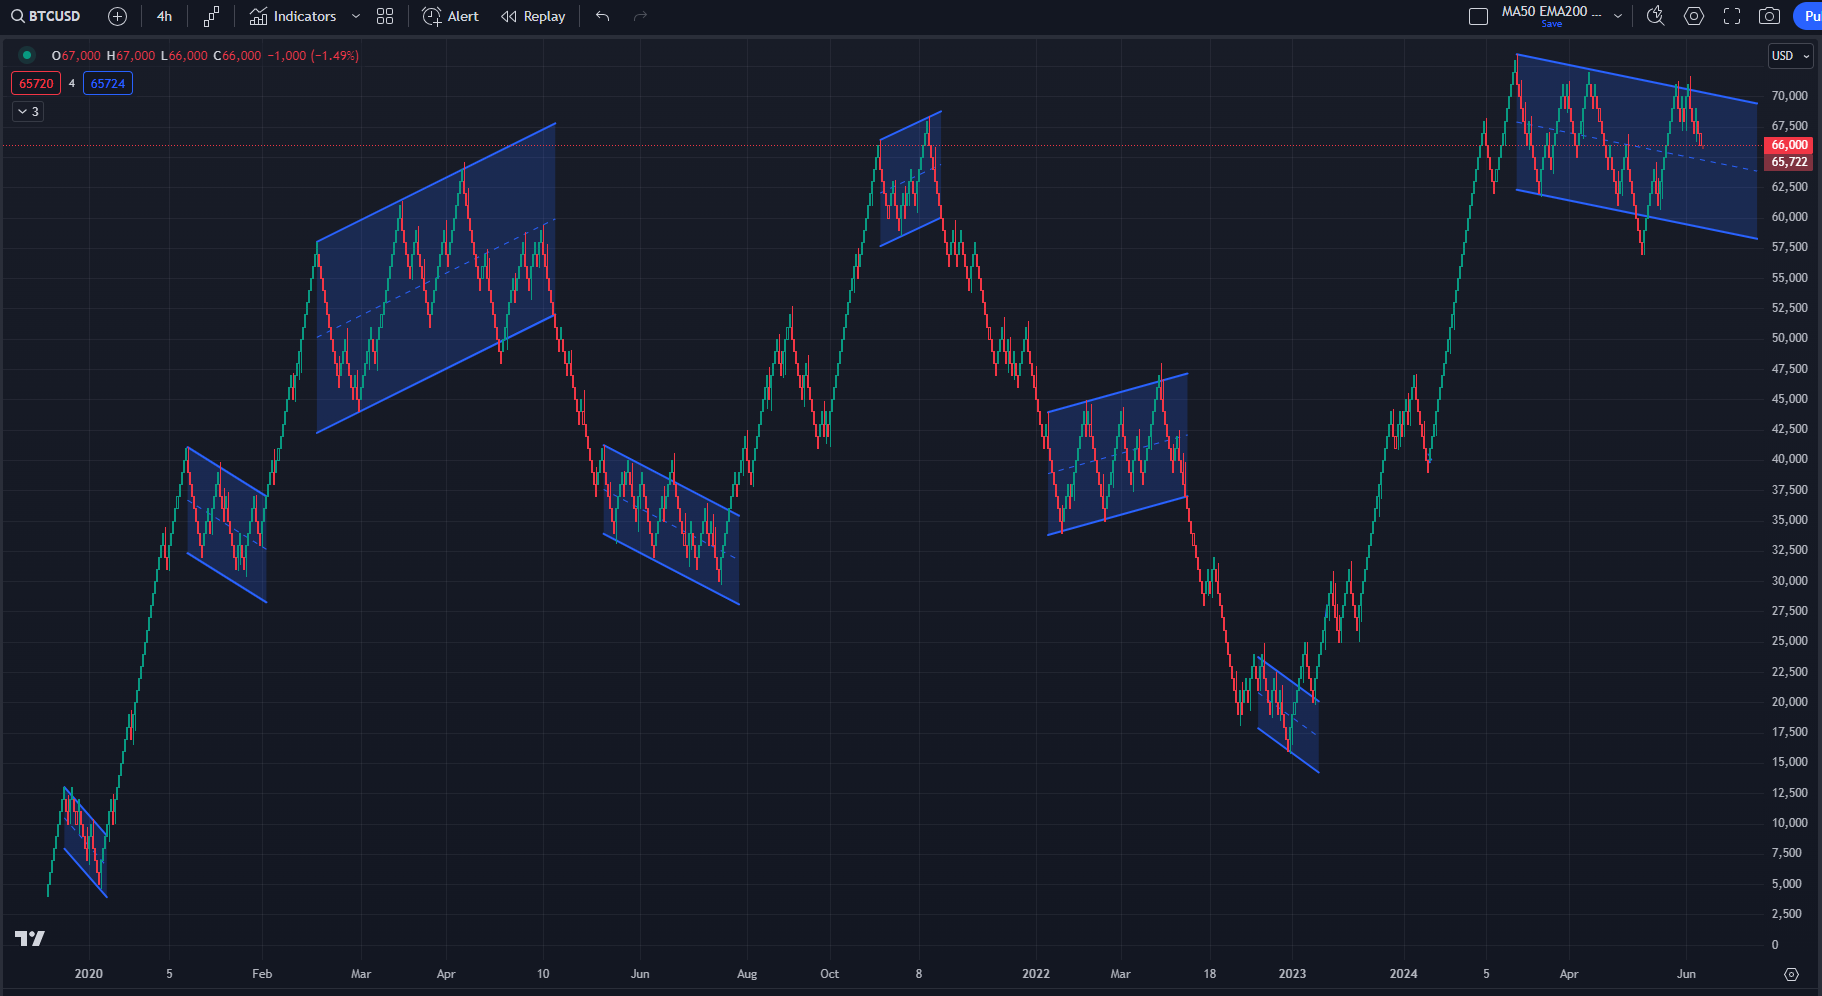
- Flagpole: A sharp, nearly vertical rise in price.
- Flag: A rectangular or slightly downward-sloping consolidation phase.
- Breakout: The pattern completes when the price breaks out above the upper trendline of the flag, resuming the uptrend.
How to Trade a Bull Flag
- Identify the Flagpole: Look for a strong upward move.
- Spot the Flag: Identify the consolidation phase, forming a flag shape.
- Wait for the Breakout: Enter a long position when the price breaks above the upper trendline of the flag.
- Set Stop Loss: Place a stop loss below the flag to manage risk.
What is a Bear Flag?
A bear flag is a bearish continuation pattern that signals a brief consolidation before the downtrend continues. It forms after a steep decline in price, known as the flagpole, followed by a period of sideways to upward consolidation that forms a flag.
Characteristics of a Bear Flag
- Flagpole: A sharp, nearly vertical drop in price.
- Flag: A rectangular or slightly upward-sloping consolidation phase.
- Breakout: The pattern completes when the price breaks out below the lower trendline of the flag, resuming the downtrend.
How to Trade a Bear Flag
- Identify the Flagpole: Look for a strong downward move.
- Spot the Flag: Identify the consolidation phase, forming a flag shape.
- Wait for the Breakout: Enter a short position when the price breaks below the lower trendline of the flag.
- Set Stop Loss: Place a stop loss above the flag to manage risk.
Significance of Bull and Bear Flags
- Trend Continuation: Both patterns indicate that the prevailing trend is likely to continue, providing traders with confidence to follow the trend.
- Entry and Exit Points: These patterns offer clear entry and exit points, making them useful for timing trades.
- Risk Management: They help in setting precise stop loss levels, enhancing risk management.
Conclusion
Bull and bear flags are powerful patterns in technical analysis, helping traders capitalize on trend continuations. By identifying these patterns and understanding how to trade them, you can improve your trading strategy and make more informed decisions. Remember, as with any trading strategy, it is essential to combine flag patterns with other indicators and analysis techniques to increase their effectiveness. Happy trading!