Mastering Renko Charts: A Quick Guide for Traders
Renko charts are a unique tool in technical analysis, focusing on price changes rather than time. Originating from Japan, these charts help traders identify trends and significant price movements by filtering out noise.
What Are Renko Charts?
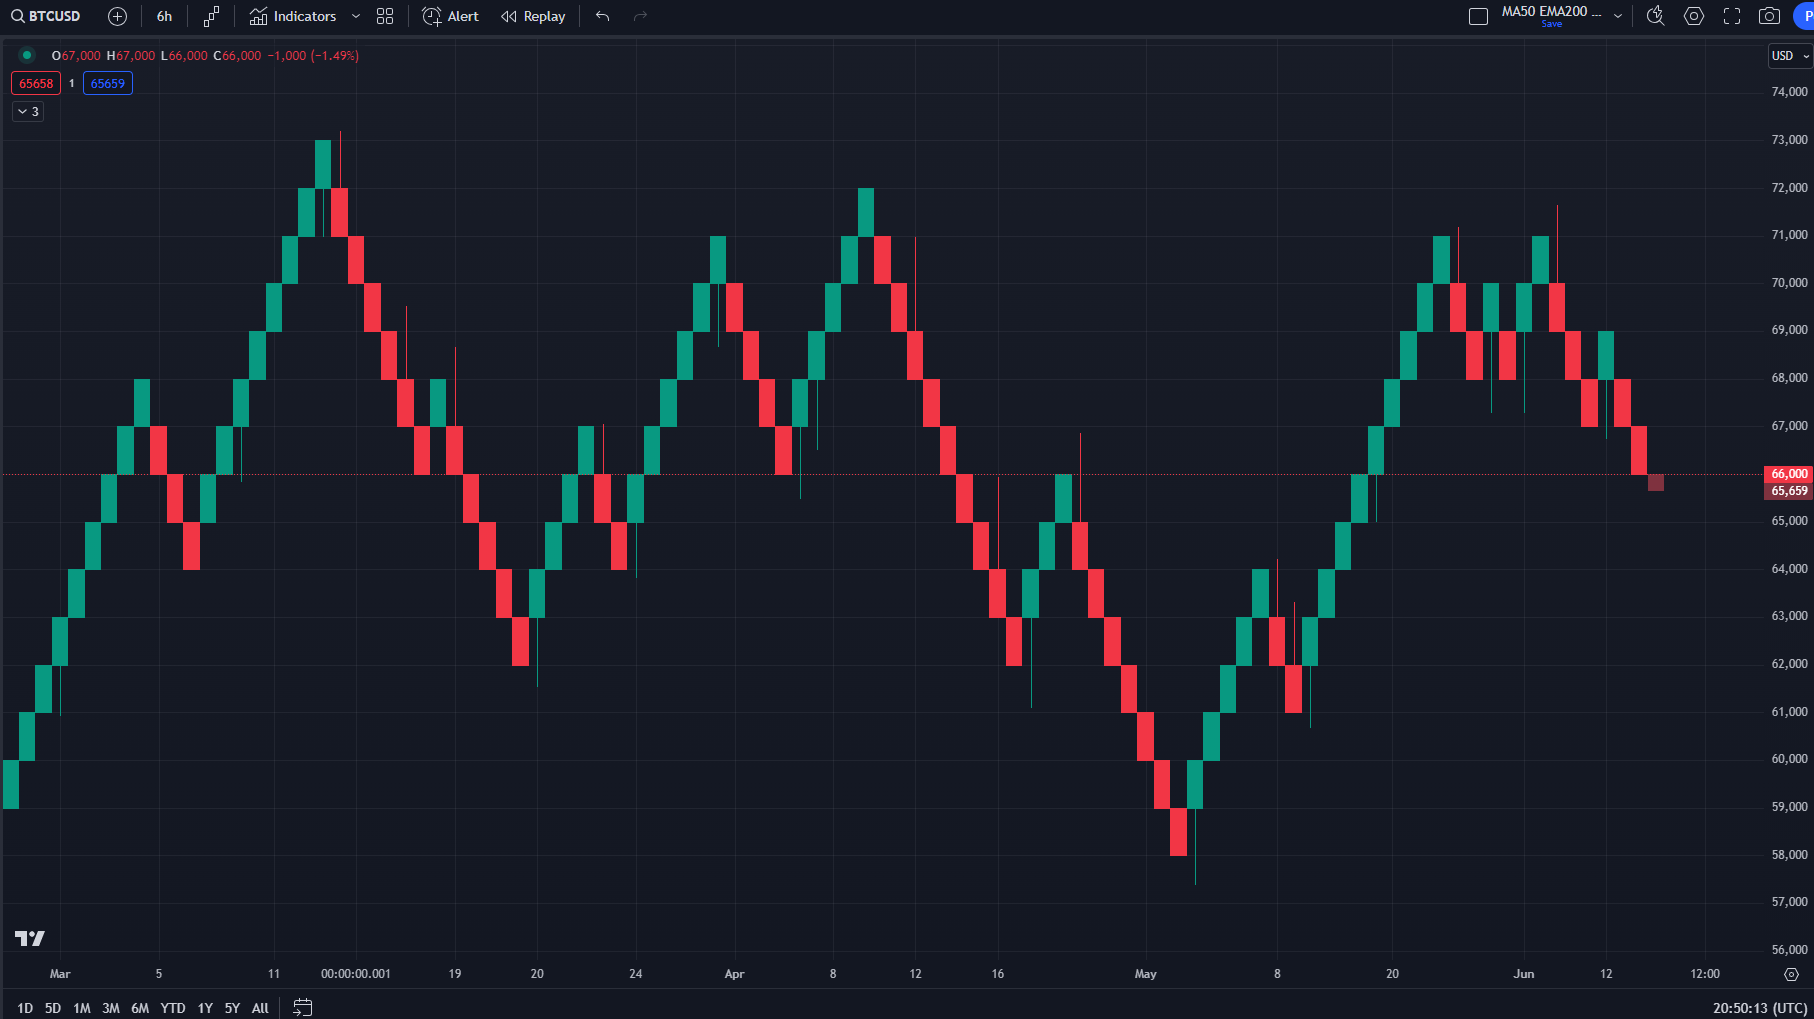
Renko charts consist of bricks that represent a fixed price move, regardless of time. A new brick is added only when the price moves by a predetermined amount. This method highlights price direction and trends more clearly than traditional charts.
How Renko Charts Work
- Brick Size: Determines the price movement required to form a new brick (e.g., $10).
- Color and Direction: Typically, white/green bricks indicate upward movement, while black/red bricks indicate downward movement.
Advantages of Renko Charts
- Simplicity and Clarity: Focuses on significant price movements, making trends easier to identify.
- Trend Identification: Long sequences of bricks in one direction signal strong trends.
- Support and Resistance: Helps pinpoint key levels by filtering minor fluctuations.
Using Renko Charts in Trading
- Set the Brick Size: Choose a size suitable for your trading style.
- Identify Trends: Look for long sequences of bricks in one direction.
- Spot Reversals: Watch for color changes in bricks.
- Combine with Indicators: Use alongside RSI, MACD, or Bollinger Bands for enhanced analysis.
Limitations
- Lagging Indicator: New bricks form after significant price moves, which can cause delays.
- Lack of Volume/Time Data: These charts omit volume and time information.
- Customization Needed: Finding the right brick size may require experimentation.
Conclusion
Renko charts offer a streamlined view of market trends by focusing on price movements. While they have limitations, their clarity and simplicity make them a valuable tool for traders. Incorporate Renko charts into your strategy for a fresh perspective on market analysis. Happy trading!